
Archived Content
Information identified as archived is provided for reference, research or recordkeeping purposes. It is not subject to the Government of Canada Web Standards and has not been altered or updated since it was archived. Please contact us to request a format other than those available.
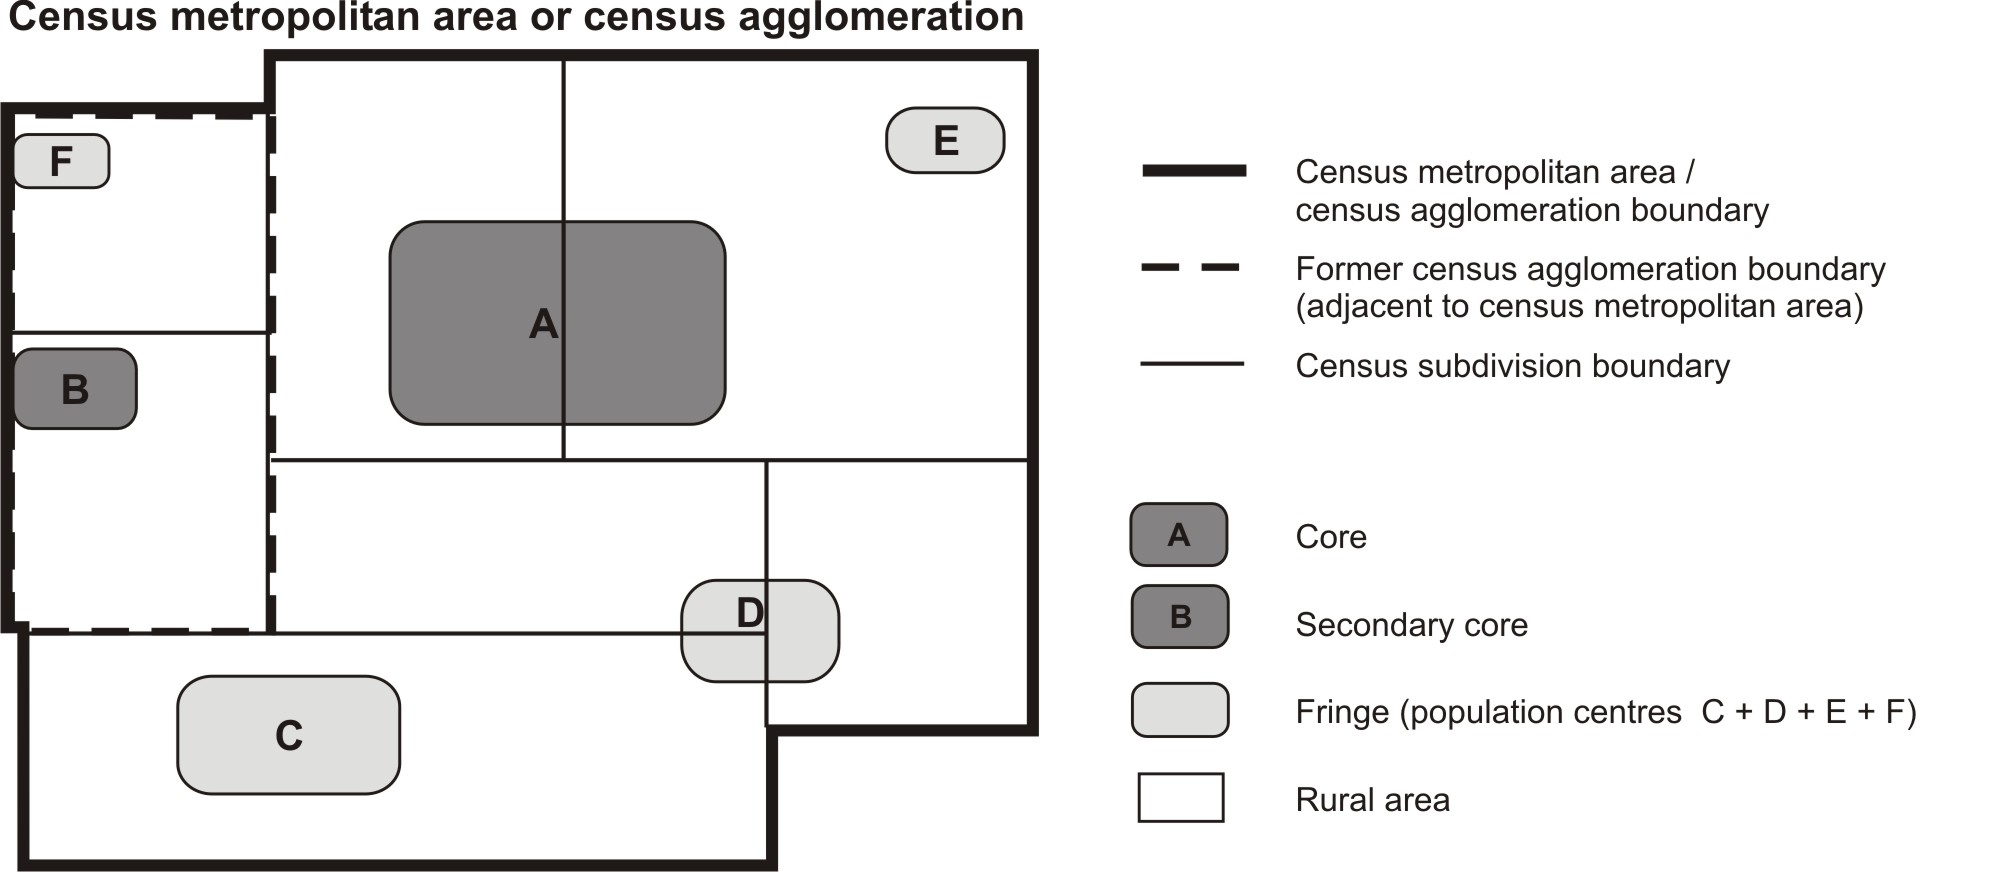
Figure 12 Example of a census metropolitan area or a census agglomeration, showing core, secondary core, fringe and rural area
Description
Figure 12 is a graphical representation of a census metropolitan area (CMA) or census agglomeration (CA) and its component census subdivisions (CSDs), core, fringe, and rural area. A fictional grouping of seven CSDs, shown as white polygons, represents the CSDs that form a CMA. A thick black line outlines the perimeter of the CSDs to identify the boundary of the CMA. Within the CMA/CA limits, two adjacent polygons in the top left quadrant are bordered with a thick dashed line to represent a former CA boundary, which was adjacent to the CMA or CA before being merged into it.
Within the CMA/CA boundary are six shaded, smaller polygons that overlap the CSD polygons. The largest of these smaller polygons, labelled 'A' and shaded dark grey, represents the core of the CMA/CA and appears just above the centre of the CMA/CA polygon. A second small polygon, also shaded dark grey and labelled 'B', appears on the far left of the CMA/CA and represents the secondary core. Four other smaller polygons, shaded light grey and labelled C, D, E and F, are scattered within the CMA/CA. These light grey polygons represent fringe (population centres that are neither a core nor a secondary core). The remaining white area of the CSDs is referred to as rural area.
A legend appears to the right of the diagram that defines the symbols used in the figure to represent the CMA/CA, the former CA boundary, CSD boundaries, the core, secondary core, fringe and rural area.
For more information on this figure, please contact Statistics Canada at 1-800-263-1136.
Source: Statistics Canada, 2011 Census of Population.
- Date modified: